Financial Model Formatting - 3 Core Best Practices
2 minute read | Dec 3, 2021
finance
Share this article:
Here are three core formatting best practices you can apply for financial models and data analyses in Excel and Google Sheets.
Formatting cheat sheet with examples (free download)
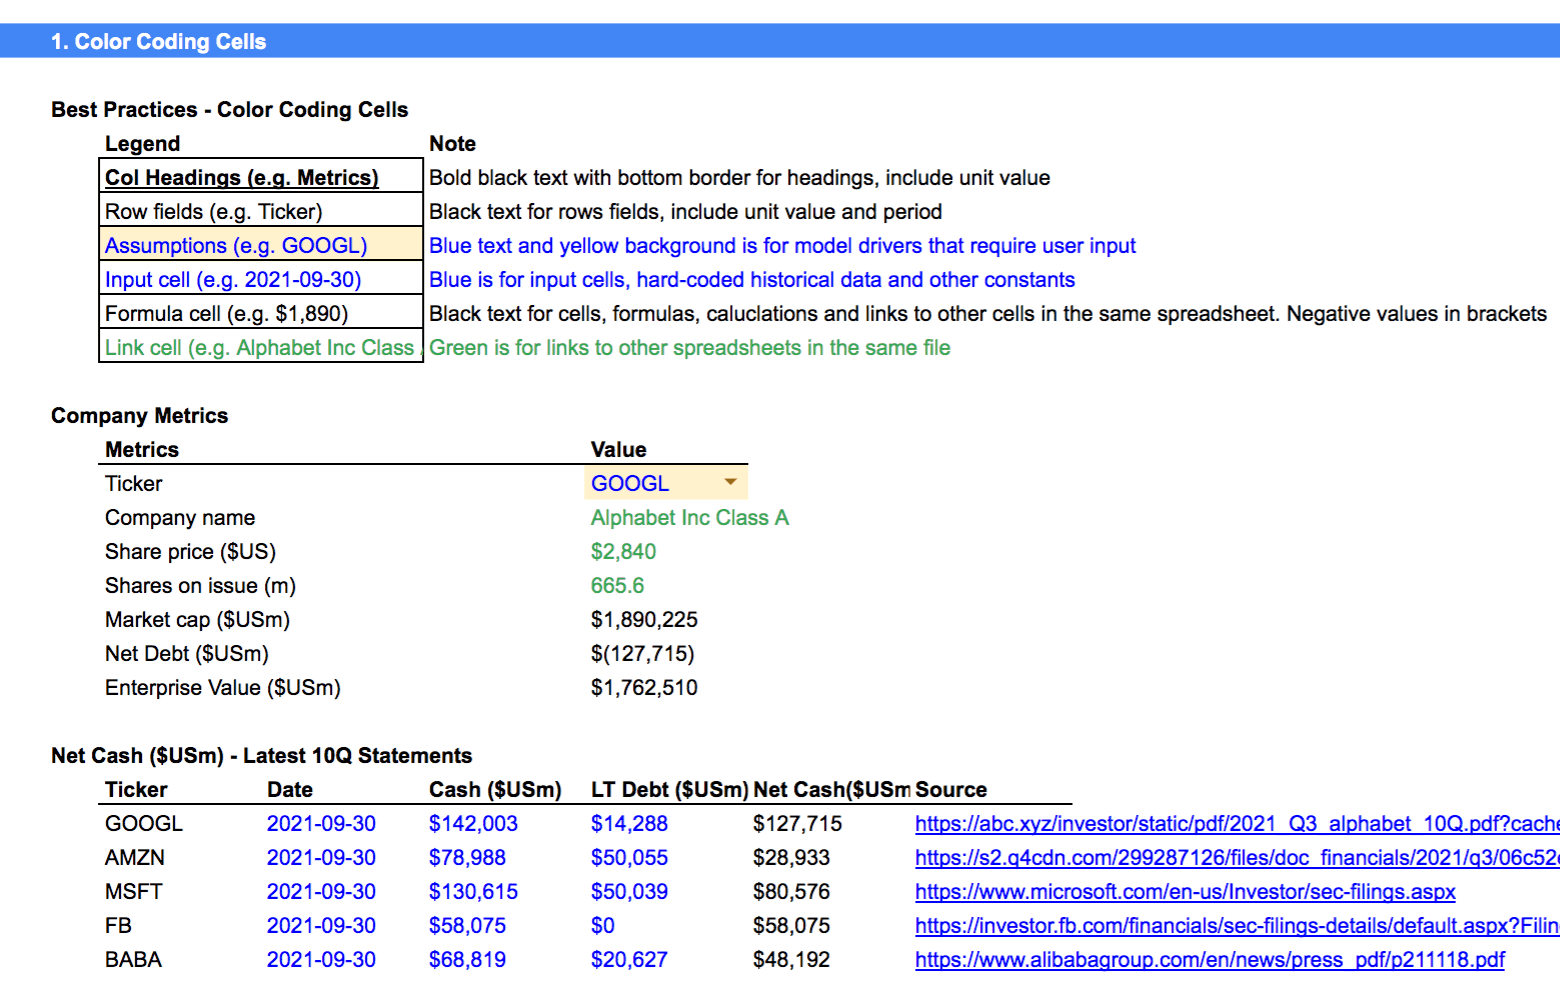
1. Color Coding Cells
- Black = formula, calculations and links to other cells
- Blue = hard coded input cells and historical data
- Blue with yellow background = key input assumptions
- Green = link to other spreadsheets in the same file
Example - Big Tech Company Metrics
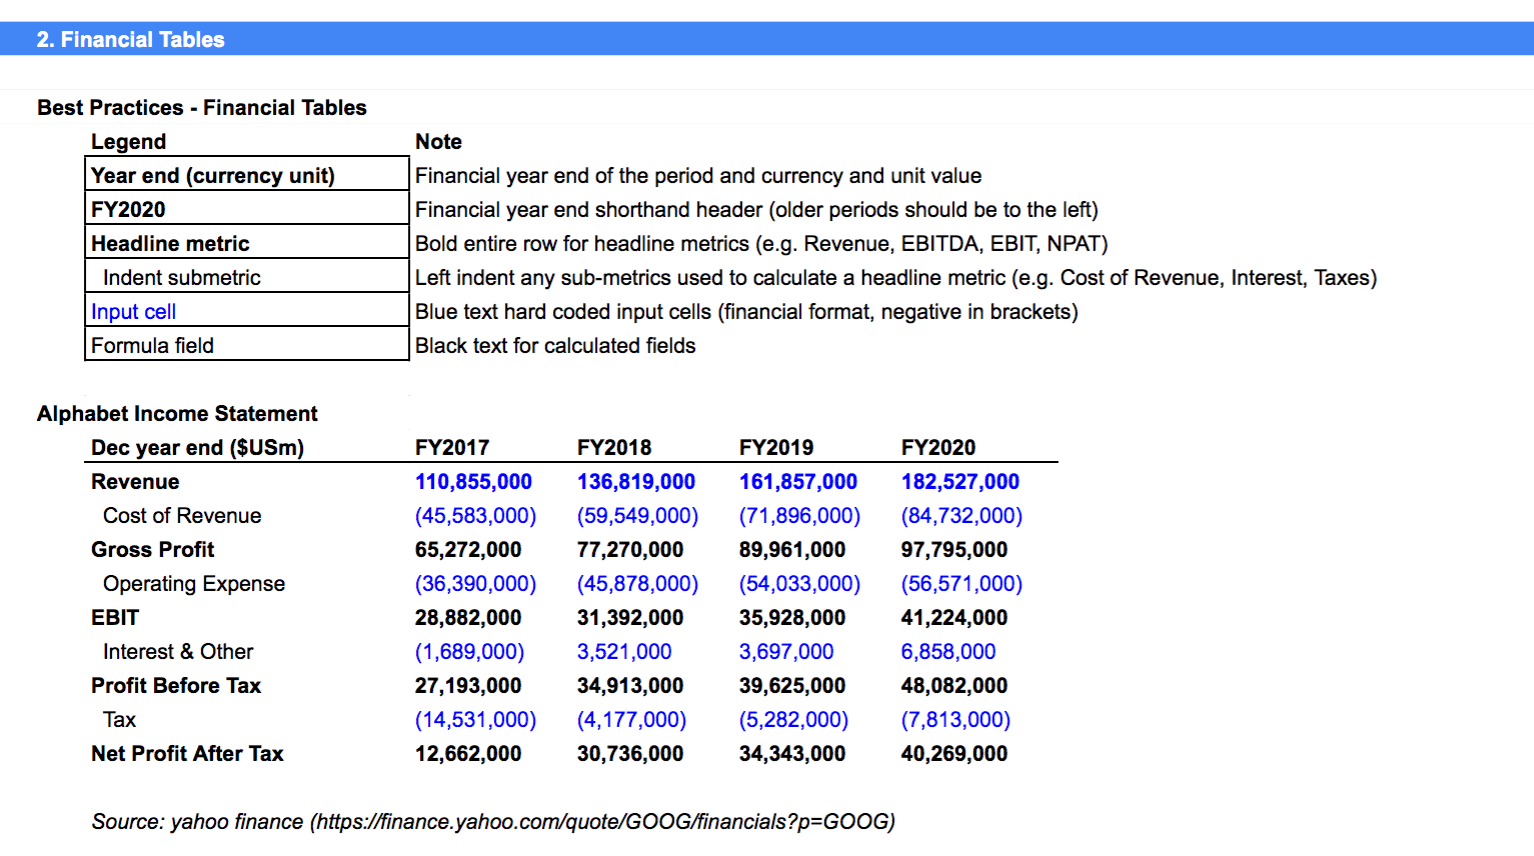
2. Financial Tables
- FY20XX = Use financial year end for your column headers, include the year end and metric in the table header
- Revenue = bold important headline metrics (Revenue, EBITDA, EBIT, NPAT)
- Cost of Revenue = indent sub metrics used to calculate headline metrics (e.g. COGS)
- Financial formatting = use brackets for negative values and avoid more than 1 dp
- Left to right = older to newer FY dates ordered left to right
Example - Alphabet Income Statement
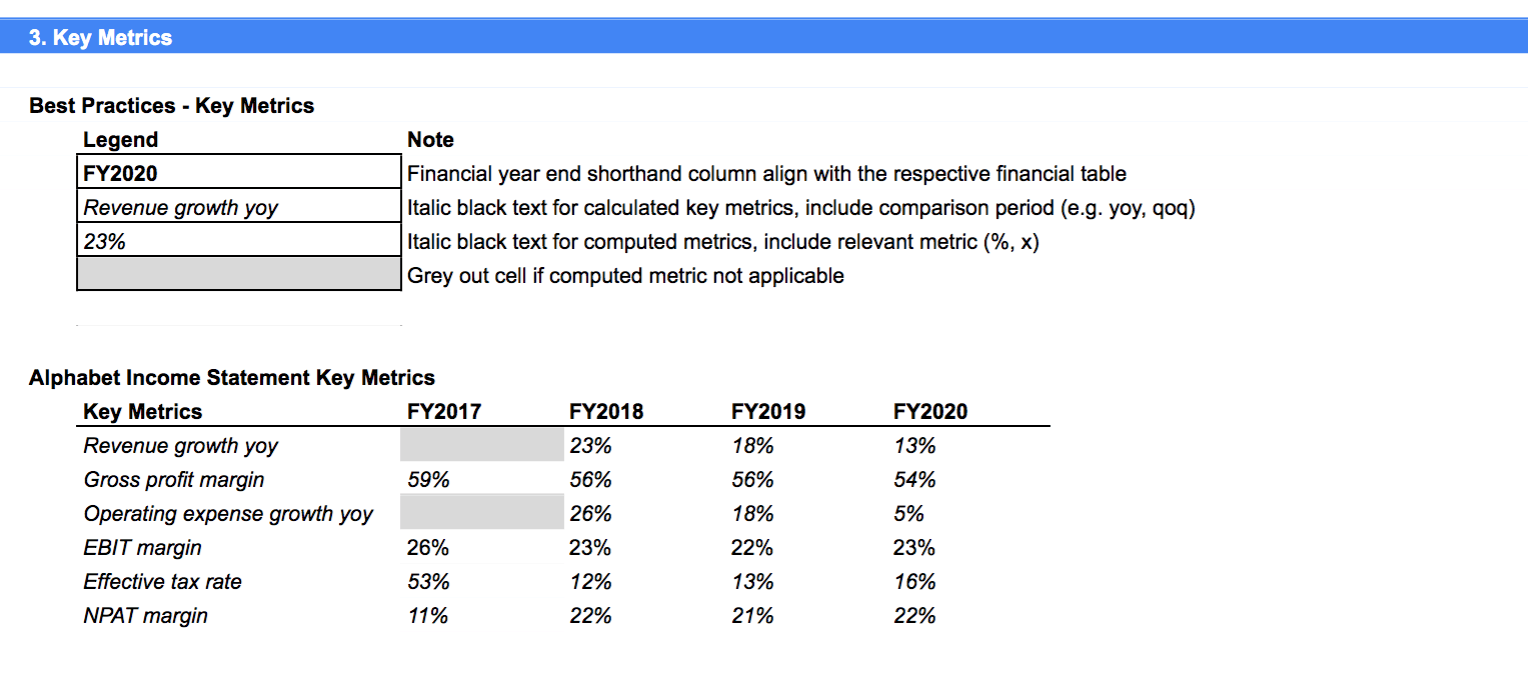
3. Key Metrics
- FY20XX = Align your key metrics under the same columns as the financial table
- Revenue growth yoy = italic text for key metrics
- 23% = italic text including the unit metric (e.g. %, x)
- Grey = grey out cells if computed metric not able to be calculated
Example - Alphabet Income Statement Key Metrics
Want more tips?
Get future posts with actionable tips in under 5 minutes and a bonus cheat sheet on '10 Biases Everyone Should Know'.
Your email stays private. No ads ever. Unsubscribe anytime.
My other project
Investor Tool
World's largest tech companies
Share this article: