Understanding 6 Key Financial Ratios - Best Buy vs Netflix vs Meta vs Apple
6 minute read | May 20, 2023
finance
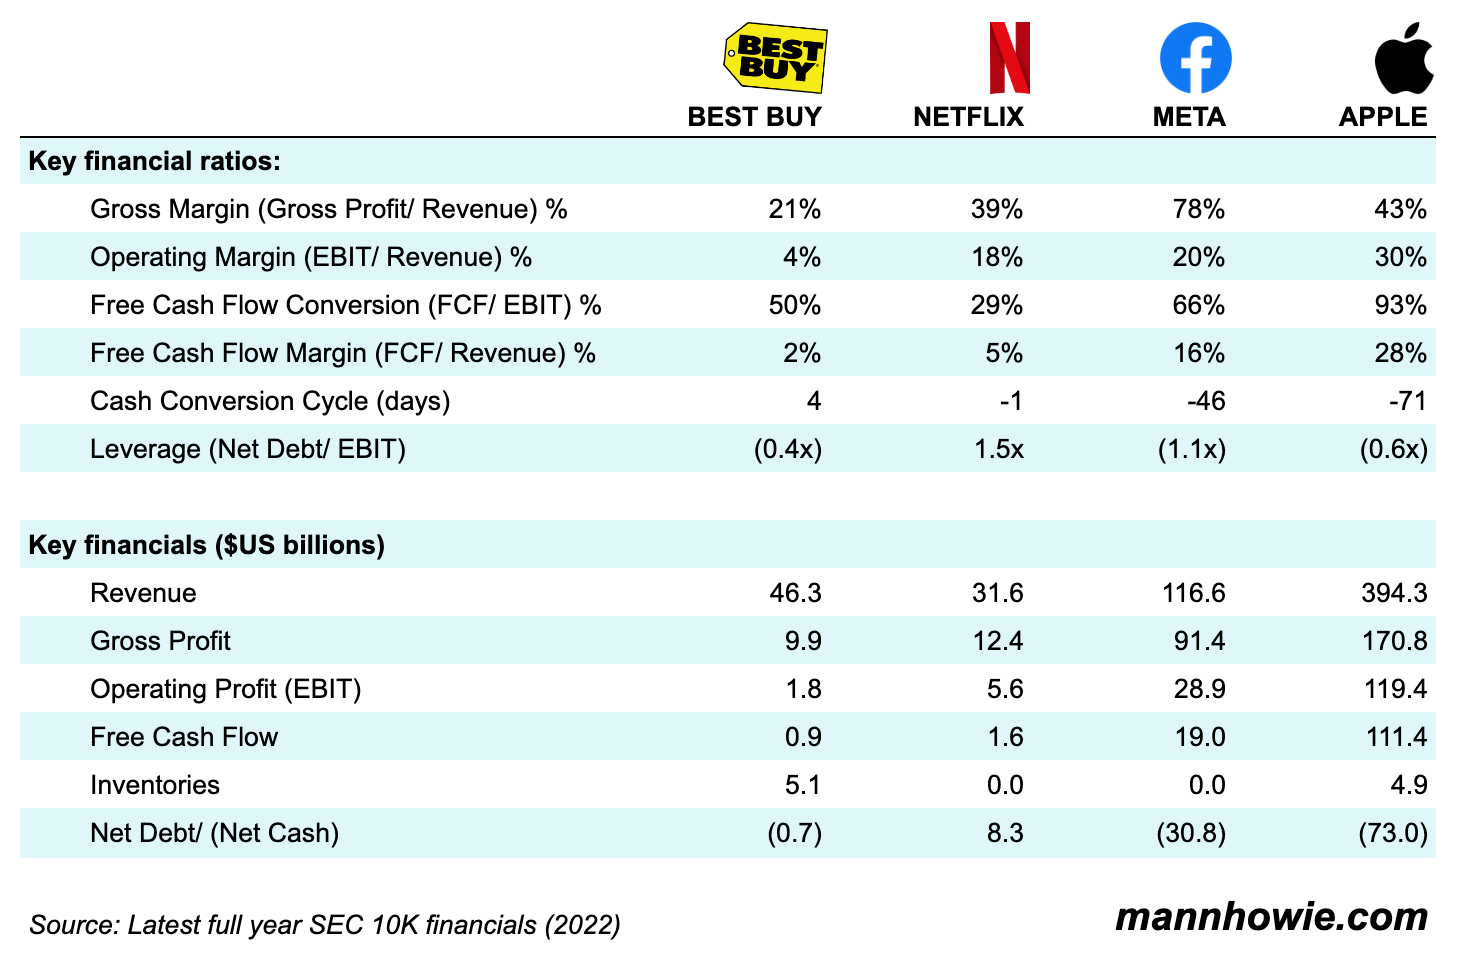
Here are the 6 key financial ratios that can offer insights into a business’s operational performance. This guide uses practical examples from well-known companies - Best Buy, Netflix, Meta and Apple. These ratios are:
- Gross Margin
- Operating Margin
- Free Cash Flow Conversion
- Free Cash Flow Margin
- Cash Conversion Cycle
- Leverage Ratio
1. Gross Margin
Gross Margin = Gross Profit / Revenue
Gross margin is a profitability indicator that shows what portion of revenue remains after deducting the cost of revenues. It's calculated by dividing gross profit by the total revenue for a given period.
Best Buy, a big-box electronics retailer operates with low gross margins (21%). Its cost of revenues include the cost of products purchased (e.g. from Apple), shipping expenses and in-store staff costs.
Meta has high gross margins (78%) as it primarily generates ad revenue on its social media platforms (Facebook, Instagram, WhatsApp) and captures the majority of that revenue. This compares to YouTube which has lower gross margins as it splits its ad revenue 55% to content creators.
2. Operating Margin
Operating Margin = Operating Profit / Revenue
Operating margin, also known as operating profit margin, serves as a key measure of profitability. This figure represents the percentage of total revenue that remains after accounting for all operating expenses - these include costs beyond just those of producing goods or services, but do not encompass financing or tax expenses. It's determined by dividing operating profit (alternatively called operating income or EBIT) by the total revenue for a specified period.
Comparing Apple and Meta, we see that despite a lower gross margin (43% vs. 78%), Apple maintains a higher operating margin (30% vs. 20%). This is due to Apple's efficient operations, strong brand, and strategic marketing spending. On the other hand, Meta spends more on research and development (30% of revenue vs. Apple's 7%) on its platforms and new VR technology, and incurs significant data management, privacy, and security costs.
3. Free Cash Flow Conversion
FCF Conversion = Free Cash Flow / Operating Profit (EBIT)
Free Cash Flow Conversion is a critical financial metric showing how efficiently a company can turn its operating profit (earnings before interest and taxes or EBIT) into free cash flow. Free cash flow represents the cash a company generates, which is available to all stakeholders, including shareholders, debt holders, and others (net operating cash flows minus capital expenditures). This metric is calculated by dividing free cash flow by the operating profit for a specified period.
Comparing Apple and Netflix, Apple is more efficient at converting its profits into available cash with a free cash flow conversion rate of 93%, compared to Netflix's 29%.
Under Tim Cook, Apple dramatically improved its cash flow by pushing inventory risks to suppliers such as Foxconn. Cook introduced “Just-in-Time” inventory management, meaning Apple only orders components as needed, reducing storage and related costs. Despite being a hardware supplier and retailer, Apple has less inventory on hand than Best Buy which generates less than 10% of Apple’s revenues.
Netflix's low cash flow conversion is due to its heavy upfront investment in content. It spends a lot upfront on producing and acquiring shows and movies, which it then gradually expenses over years. This means the cash is spent before it fully impacts their profits, leading to lower cash flow.
4. Free Cash Flow Margin
FCF Margin = Free Cash Flow / Revenue
This ratio indicates how much of the company's revenues are converted into free cash flow. A higher percentage means the company is more efficient at converting sales into cash. It is calculated by dividing free cash flow by the revenue over the specified period.
Apple leads in this metric as well with 28%. This means that for every $100 in revenue Apple generates, $28 is available to shareholders to be paid out as dividends, share repurchases or further reinvestment. This compares to Netflix with 5% and Best Buy at 2%.
5. Cash Conversion Cycle
Cash Conversion Cycle = Days Inventory Outstanding + Days Sales Outstanding - Days Payable Outstanding
The Cash Conversion Cycle (CCC) measures the length of time a business takes to pay for inventory from its suppliers to when it collects cash from its customers. Calculated as the days inventory, plus the days sales (receivables collection period) minus the days payable.
- Days Inventory Outstanding = Inventory Closing / Cost of Revenues x 365 days
- Days Sales Outstanding = Receivables Closing / Revenues x 365 days
- Days Payable Outstanding = Payables Closing / Cost of Revenues x 365 days
When we compare Best Buy and Apple, we see quite a contrast. Best Buy has a CCC of 4 days while Apple has a CCC of negative 71 days.
Apple's negative CCC indicates that it collects payments from its customers much quicker than it needs to pay its suppliers. This situation is a result of Apple's efficient supply chain, powerful negotiation position with suppliers, and fast inventory turnover due to high consumer demand for its products.
On the other hand, Best Buy's positive CCC reflects its retail business model, where it must purchase inventory upfront, hold it in stores until a customer purchases it, and then wait for the transaction to clear. Best Buy's shorter cash conversion cycle still reflects efficient operations for a retail company, but its nature of business doesn't allow the luxury of a negative CCC like Apple.
6. Leverage Ratio
Leverage Ratio = Net Debt / Operating Profit (EBIT)
The leverage ratio is an important metric that assesses a company's financial health by measuring the extent to which it uses borrowed money (debt) to finance its operations. In this context, we're specifically looking at net debt (total debt minus cash and cash equivalents) divided by operating profit, also known as earnings before interest and taxes (EBIT).
Apple's leverage ratio of -0.6x suggests a strong financial stance, with more cash than total debt, largely due to efficient cash management and substantial profits. In comparison, Netflix, with a 1.5x leverage ratio, carries more debt than cash, attributed to substantial upfront investments in content, often financed through debt.
A more conservative measure would be to look at the leverage ratio against Free Cash Flow. Given Netflix’s poor FCF conversion this would imply a leverage ratio (Net Debt/ FCF) of 5.1x. This means that it would take more than 5 years for Netflix to repay its debts from operating free cash flows leaving nothing for shareholders or reinvestment.
Want more tips?
Get future posts with actionable tips in under 5 minutes and a bonus cheat sheet on '10 Biases Everyone Should Know'.
Your email stays private. No ads ever. Unsubscribe anytime.
My other project
Investor Tool
World's largest tech companies