How Much is YouTube Worth? Over US$180bn in 2022
17 minute read | Sep 6, 2022
finance
Google acquired YouTube for US$1.6 billion back in 2006. We estimate YouTube to be worth over US$180 billion in 2022, delivering Google a +110x return. YouTube as a standalone listed company would be amongst the largest video and entertainment companies in the world.
This article covers in-depth how we arrive at this valuation and the steps you can follow to build your own model for YouTube and to value any technology company:
Key Sections:
- YouTube Revenue
- YouTube Market Share
- YouTube Users
- YouTube Monetization
- YouTube Net Worth & Earnings of Creators
- YouTube Profit Margins
- YouTube Growth Forecasts
- YouTube Financial Model
- Download YouTube Valuation Model
YouTube Business Model
YouTube is the world’s largest online video service and competes for user viewership in order to compete for digital advertising spend from businesses. YouTube’s parent is Google/ Alphabet and operates globally except China where Google is banned.
To reach a valuation for YouTube, we must firstly answer 5 questions about the business:
- Revenue: What is its revenue model and key drivers?
- Industry: What industry does it compete in?
- Customer: Who are its customers and how does it deliver them value?
- Costs: What are its major costs and how are they managed?
- Growth: What is the growth thesis?
1. YouTube Revenue
YouTube generated an estimated ~US$35 billion in annual revenue in 2021-22. YouTube has two primary revenue streams:
- Ad sales (85% revenue): YouTube sells targeted ads within video content across its +2 billion monthly active users. It shares ad revenue with content publishers via a 45/55 split in favour of publishers; and
- Subscription (15% revenue): YouTube premium offers an ad free video experience and music service offered at ~$12 per month. There are currently 50 million premium subscribers representing +2% of YouTube’s total monthly active user base
2. YouTube Market Share
YouTube has an estimated 4% share of digital ad spend globally (ex China).
Global ad spend (ex China) is +$700bn dollars annually, of which +60% is spent on digital (web and mobile) having dramatically grown from a pre pandemic share of 50%.
Alphabet (Google Search, Display and YouTube) and Meta (Facebook, Instagram) dominate digital ad spend with a combined global ad share of 58% and 76% ex China. However, their dominance is being threatened by newer social media entrants (TikTok) and other big tech players (Amazon and Apple).
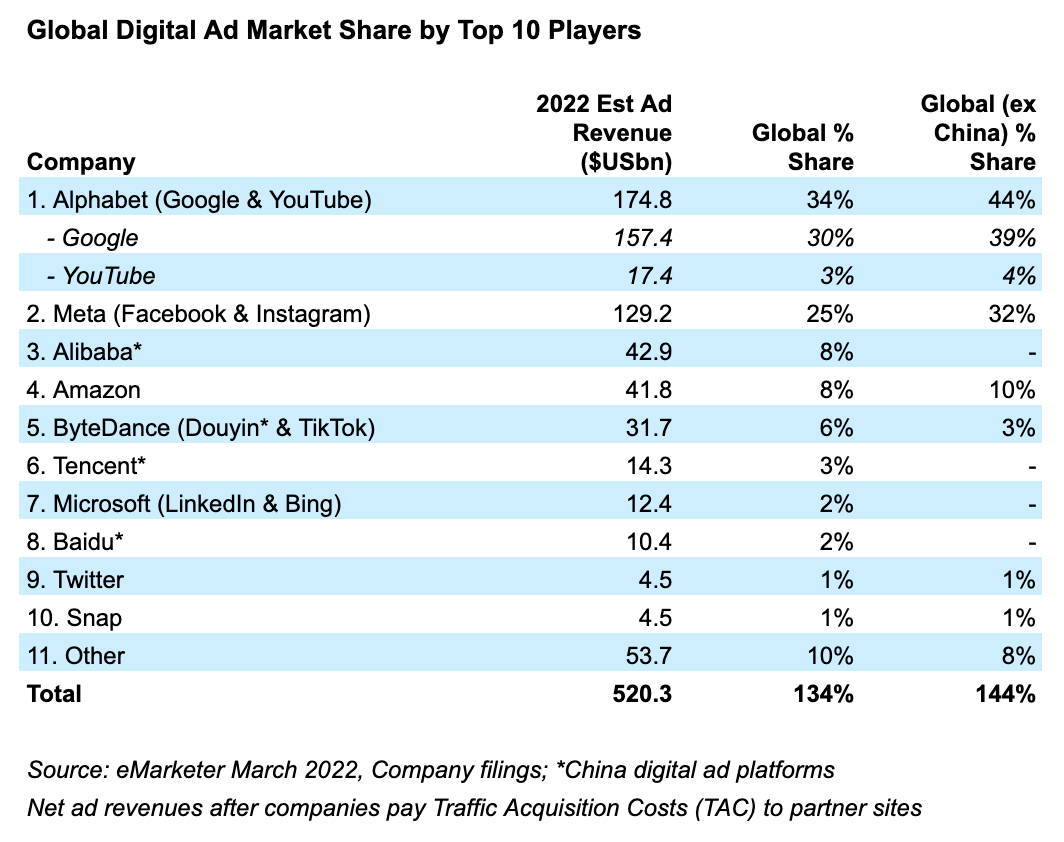
Industry estimates suggest global digital ad spend (ex China) in a post-pandemic world to increase from ~$466bn in 2022 to reach ~$686bn by 2026 whilst maintaining overall % of overall media spend between 62-65% (source: eMarketer).
When looking at the industry a company operates in, focus on how the company generates revenue and compare against competitors and alternative mediums. Research industry statistics and competitor annual reports to get a rough estimate of how large the current industry is.
3. YouTube Users
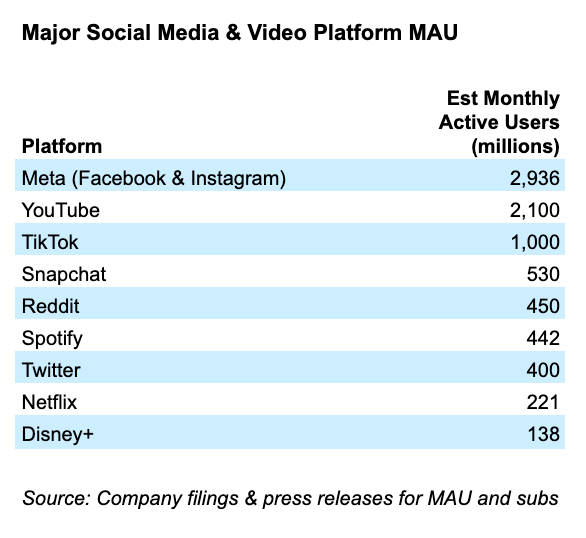
YouTube has over 2 billion monthly active users and is the second largest social media platform in the world.
YouTube is an online video platform that allows content creators (individuals and businesses) to publish videos for users to watch. YouTube sells ads to businesses placed within video content and shares the revenue with publishers.
YouTube delivers value to 3 key stakeholders:
- Creators: monetize their video content on the platform with the widest reach. Allows creators to focus on producing quality content and outsource hosting and marketing costs to YouTube
- Users: free, targeted and relevant video content and entertainment (for better or worse)
- Advertisers: brand impressions and targeted reach across a global audience
YouTube ultimately competes for global viewership and monetizes this by selling ads to businesses.
Whilst each player competes for viewership, their target audience and monetization models differ:
- Facebook, Instagram, Tiktok, and Twitter sell ads placed in a user’s social media feed of images, video, news, articles
- Netflix and Disney+ sell subscription services to users for its original and purchased content
- Spotify sells a combination of subscription services and ad supported free listening for music and podcasts
When understanding how a company generates revenue, ask yourself: Who is the customer and why would they pay for the offering? For technology platform companies, understand the ecosystem of stakeholders and the benefit each of them receive from using the platform.
4. YouTube Monetization
YouTube’s key revenue driver is its ability to monetize its monthly active user base. We can assess its performance vs peers by comparing the average annual ad spend generated by each provider divided by its monthly active user base.
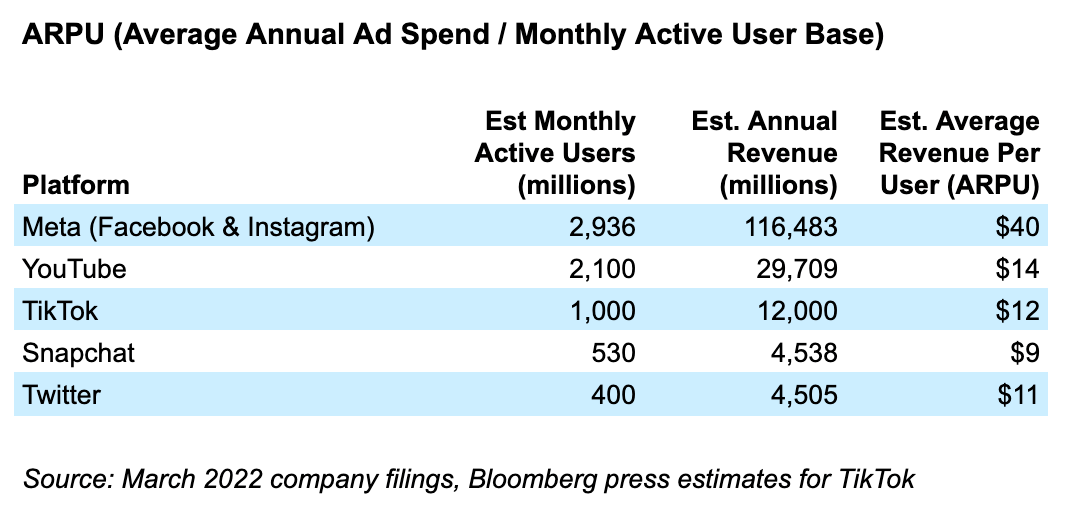
Facebook currently generates ~3x higher ad revenue per active user than YouTube across both Facebook and Instagram platforms. This could be explained by Facebook’s greater variety of ad formats and granular audience targeting (interests, age, behaviour, lookalike audience) and being further along its journey of ad monetization.
The biggest driver of revenue for YouTube will likely be its ability to drive higher ad spend to its already large audience via product innovation (e.g. new ad formats, improved targeting) rather than growing its audience. YouTube is also earlier in its monetization strategy and has also invested significant resources to clean up the quality of content published. Downward pressure to ARPU is likely to come from competitive pressure from rivals (e.g. TikTok) and risk of lower monetization capability from short form videos.
The key to understanding any revenue model is to identify the key revenue drivers: 1) volume (e.g. customers, users, businesses), 2) pricing (ARPU, new products, upsell) and 3) churn (% customers leaving each month, non-renewals). Try and understand the narrative of how the company can influence these drivers.
5. YouTube Net Worth & Earnings of Creators
YouTube shares 55% of ad revenue with publishers via content costs. In 2021 YouTube paid an estimated $15.9bn to creators and is expected to pay over $19bn in 2022.
YouTube has dramatically increased the net worth of creators. The top 10 highest paid YouTube stars was estimated by Forbes to have generated $300m in earnings throughout 2021 with half of that coming from YouTube ad revenue. The highest star being Mr Beast with estimated ad earnings of $27m and over 100m subscribers.
YouTube's viewership and ad monetisation is highly diversified with the top 10 highest paid creators representing less than 1% of the total ad revenue YouTube pays to creators globally.
Top 10 YouTube Creators - Est Ad Revenue and % Share (2021)
| YouTube Channel (subs) | Est YouTube Publisher Ad Revenue ($USm) | % of YouTube Publisher Ad Revenue | % of YouTube MAU |
|---|---|---|---|
| 1. Mr Beast (104m) | 27 | 0.2% | 5.0% |
| 2. Markiplier (34m) | 19 | 0.1% | 1.6% |
| 3. Rhett & Link (18m) | 16 | 0.1% | 0.9% |
| 4. Unspeakable (14m) | 14 | 0.1% | 0.7% |
| 5. Like Nastya (100m) | 14 | 0.1% | 4.8% |
| 6. Ryan Kaji (33m) | 14 | 0.1% | 1.6% |
| 7. Dude Perfect (58m) | 10 | 0.1% | 2.8% |
| 8. Logan Paul (24m) | 9 | 0.1% | 1.1% |
| 9. Preston (21m) | 8 | 0.1% | 1.0% |
| 10. Jake Paul (20m) | 5 | 0.0% | 1.0% |
| 11. Other | 15,730 | 99.1% | - |
| Total | 15,865 | 100.0% | - |
Source: Forbes 2021 (estimated 50% of total revenue from Ad revenue), Alphabet financials
6. YouTube Profit Margins
YouTube has an estimated gross profit margin of ~38% which is signficantly lower than competitor Meta (Facebook, Instagram) with ~80%. This is attributable to YouTube's revenue sharing model paying a significant proportion of ad revenues to content creators.
YouTube’s major costs can be separated across 3 categories:
- Cost of Revenue: variable costs associated with delivery of services and revenue. Includes ad share revenue paid to creators and data-centre operation and hosting costs;
- Operating Costs: largely staff and support related costs to drive platform and product development (R&D), revenue growth and creator support (Sales & Marketing), content moderation, finance, admin (General & Admin); and
- Capex & Acquisitions: investments in data-centre infrastructure, acquisitions of businesses and supporting tech. These are cash outflows not captured in the income statement
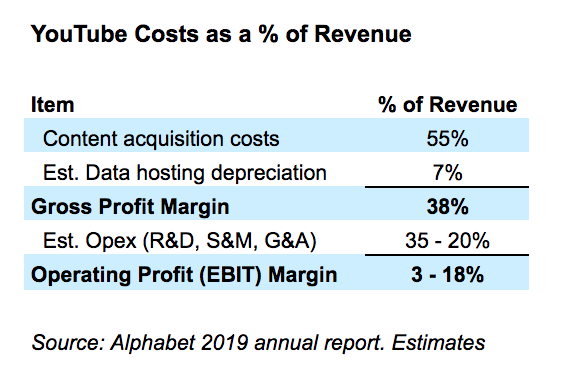
Cost of Revenue YouTube’s largest cost base is the revenue it shares with content publishers. It splits ad and subscription revenue attached to content viewership in the ratio 45/ 55% in the favour of publishers.
YouTube’s other major variable costs are the delivery and data-centre operation costs for the 500 hours of video content that gets uploaded every minute. These costs largely include depreciation charges following major upfront capex investments in data-centres. We estimate 7% in line with Alphabet’s overall depreciation charge as % of revenue.
Operating Costs Alphabet does not publicly disclose YouTube’s other operating expenses so we will need to estimate.
YouTube’s major fixed costs are its operating costs which are largely staff related and associated with sales and marketing, supporting creators, research & development (software and product roles), content moderation (outsourced contractors), finance, admin and support.
We can estimate YouTube’s opex margins by comparing against peers. Netflix has a total opex/ revenue of 20% and Facebook at ~35-45%. We can estimate that YouTube may currently operate within the range at 35% opex/ revenue. We can assume given scale benefits that this will lower over time in line with Netflix at 20% opex as % of revenue.
This analysis highlights that YouTube’s profitability is lower than other social media platforms and Google’s other ad businesses. This is largely due to YouTube’s reliance on ad sharing with content publishers.
Capex & Acquisitions Alphabet does not separate YouTube’s cashflow financials so we must estimate capex figures.
In our methodology, depreciation is already accounted for in the operating expenses hence we must estimate the incremental net capital expenditure (e.g. capex less depreciation) in order to estimate the total cash outflows associated with investment in infrastructure.
We adopt Aswath Damodaran's (the leading authority on company valuations) approach of using the sales to capital ratio to estimate the required net capex to support revenue growth. This is calculated as the net change in revenue divided by the net capex of each year.
Alphabet has an average sales to capital ratio of 1.9x (annual change in revenue divided by change in invested capital (debt + equity less cash)). This implies that for every $100 of incremental revenue Alphabet generates each year it reinvests $50 as capital to support growth.
When estimating costs, identify the major drivers across cost of revenue, operating costs and capex costs. Go through annual financial reports to identify the major line items and review notes to understand what is included and not included and understand the main drivers.
7. YouTube Growth Forecasts
Based on our above analysis and understanding we base our growth thesis for YouTube on two key drivers: ad monetization and stable user growth.
Ad Monetization YouTube is early in its monetization strategy and has largely relied on ad revenue from high quality in-video ad formats driven by impressions. It has begun to experiment with new formats including direct response display ads within homepage recommendation feeds, direct text search ads and new ad formats for short form video (compete against TikTok). These new formats support greater ability to sell more ads to its user base.
We estimate that YouTube over the next 10 years will increase its ad monetization from $16 ARPU to +$40 ARPU in line with Facebook currently.
Stable User Growth YouTube shares a majority of ad revenue to content publishers which is negative for gross profit margins but positive for supporting high quality content creation. This will likely attract amateur and professional content publishers to continue choosing YouTube as their platform of choice for social media monetization.
We will conservatively estimate that user growth while mature, will still grow from 2 to 2.8 billion monthly active users over the next decade. Similarly, we assume a portion of active users will prefer an ad-free experience and so we forecast YouTube premium subs to increase from 50 to 175 million active users over the same period (in line with Spotify's current paying subscriber numbers).
These are conservative forecasts and take into consideration an element of heightened competition from incumbents and newcomers e.g. Instagram, TikTok, ...the next thing.
8. YouTube Financial Model
With our supporting growth thesis for YouTube established, we are able to forecast the future generated cash flows over the next 10+ years.
Revenue forecasts The key revenue drivers are Monthly Active Users, ARPU, Premium Subs and Pricing. We then cross check this against our estimates for the global digital ad spend market.
YouTube Forecast Revenue Model
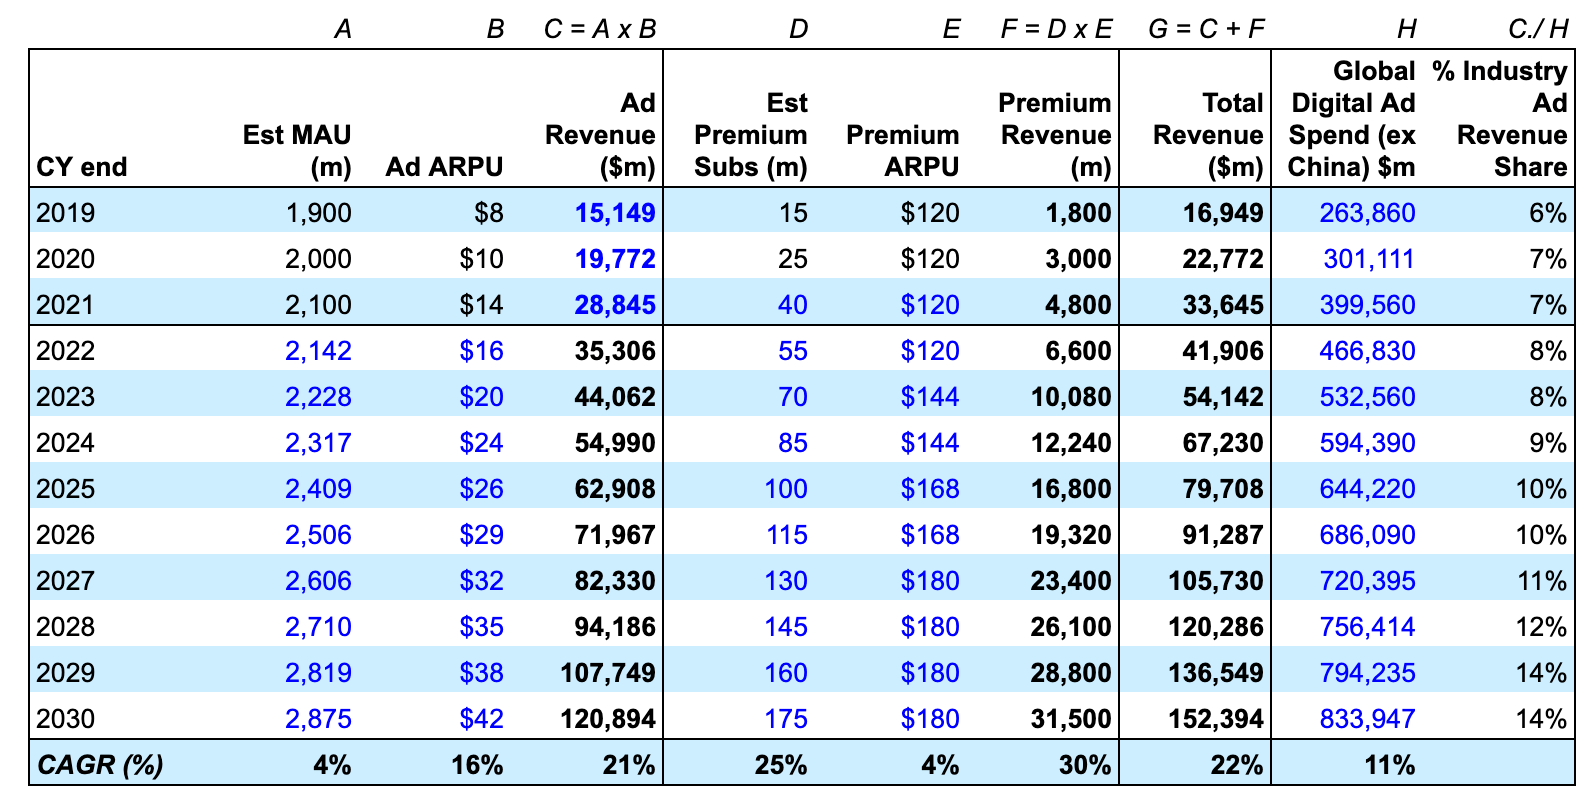
Our thesis implies that over the next decade, YouTube will grow from a ~$33bn annual revenue business with 7-8% share of the digital ad spend (pre Traffic Acquisition Costs), to become a $120bn business with the majority of revenue dominated by ad spend and a doubling of its share of global digital ad spend (ex China) to 14%.
Cost and Profitability forecasts Following our revenue forecasts we must estimate operating costs and reinvestment rates to arrive to our forecast free cash flow figure
YouTube Forecast Operating Cost and Cash Flow Model
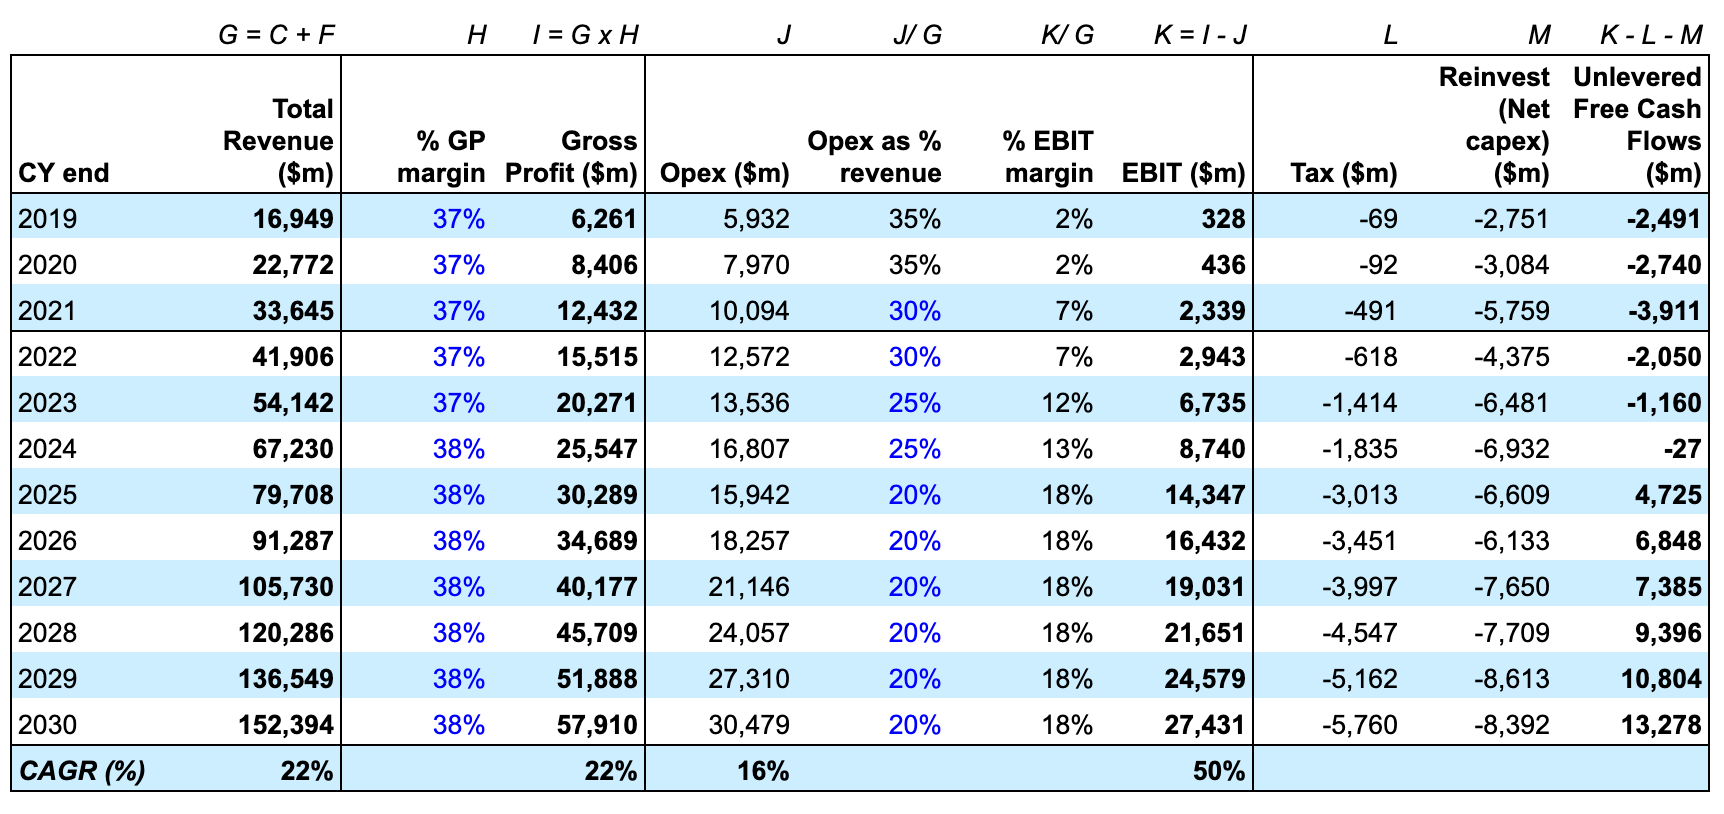
- Cost of revenue: we assume YouTube will remain a platform for high quality video content published by creators and will continue to pay out majority of ad revenue to creators. This implies gross profit margins will remain largely unchanged at ~37%
- Operating costs: assumed to fall over time from 35% to 20% of revenues as platform ad monetization scales
- Taxes: assume an effective blended US and global tax rate of 21%
- Reinvestment: sales to capital ratio of 1.9x in line with Alphabet which implies YouTube reinvests 50% of revenue growth back into the business
When forecasting revenues, costs and cashflows follow 3 key steps: 1) identify the key drivers for each component; 2) formulate a thesis that supports each driver; and 3) cross check against industry assumptions and peer metrics.
9. YouTube Valuation Model
Putting it all Together - What is the Valuation for YouTube? To complete our valuation we must estimate the terminal value at the end of our 10 year forecast period. The terminal value represents the present value of the company’s cash flows at that time assuming the cash flows of the firm will grow at a constant rate forever.
We need two final assumptions to arrive at our terminal value:
- Long term growth rate: this is the constant rate we expect YouTube to grow in perpetuity beyond year 10. We assume this to be 3.5% (higher than long term US GDP but lower than the long term forecast growth in digital ad spend)
- Discount rate: this is the rate we will discount future cash flows to arrive at our present value. We assume this to be 8% based on current long term risk free rate of ~3% (US 10 Yr Treasury Yield) and an equity risk premium of ~5%. See previous post to understand the principles of a discount rate when valuing businesses.
With these two assumptions we can arrive at our terminal value. The formula for terminal value which applies the perpetual growth model is beyond the scope of this article but in essence calculates the present value of an annuity (see this article for the formula proof).
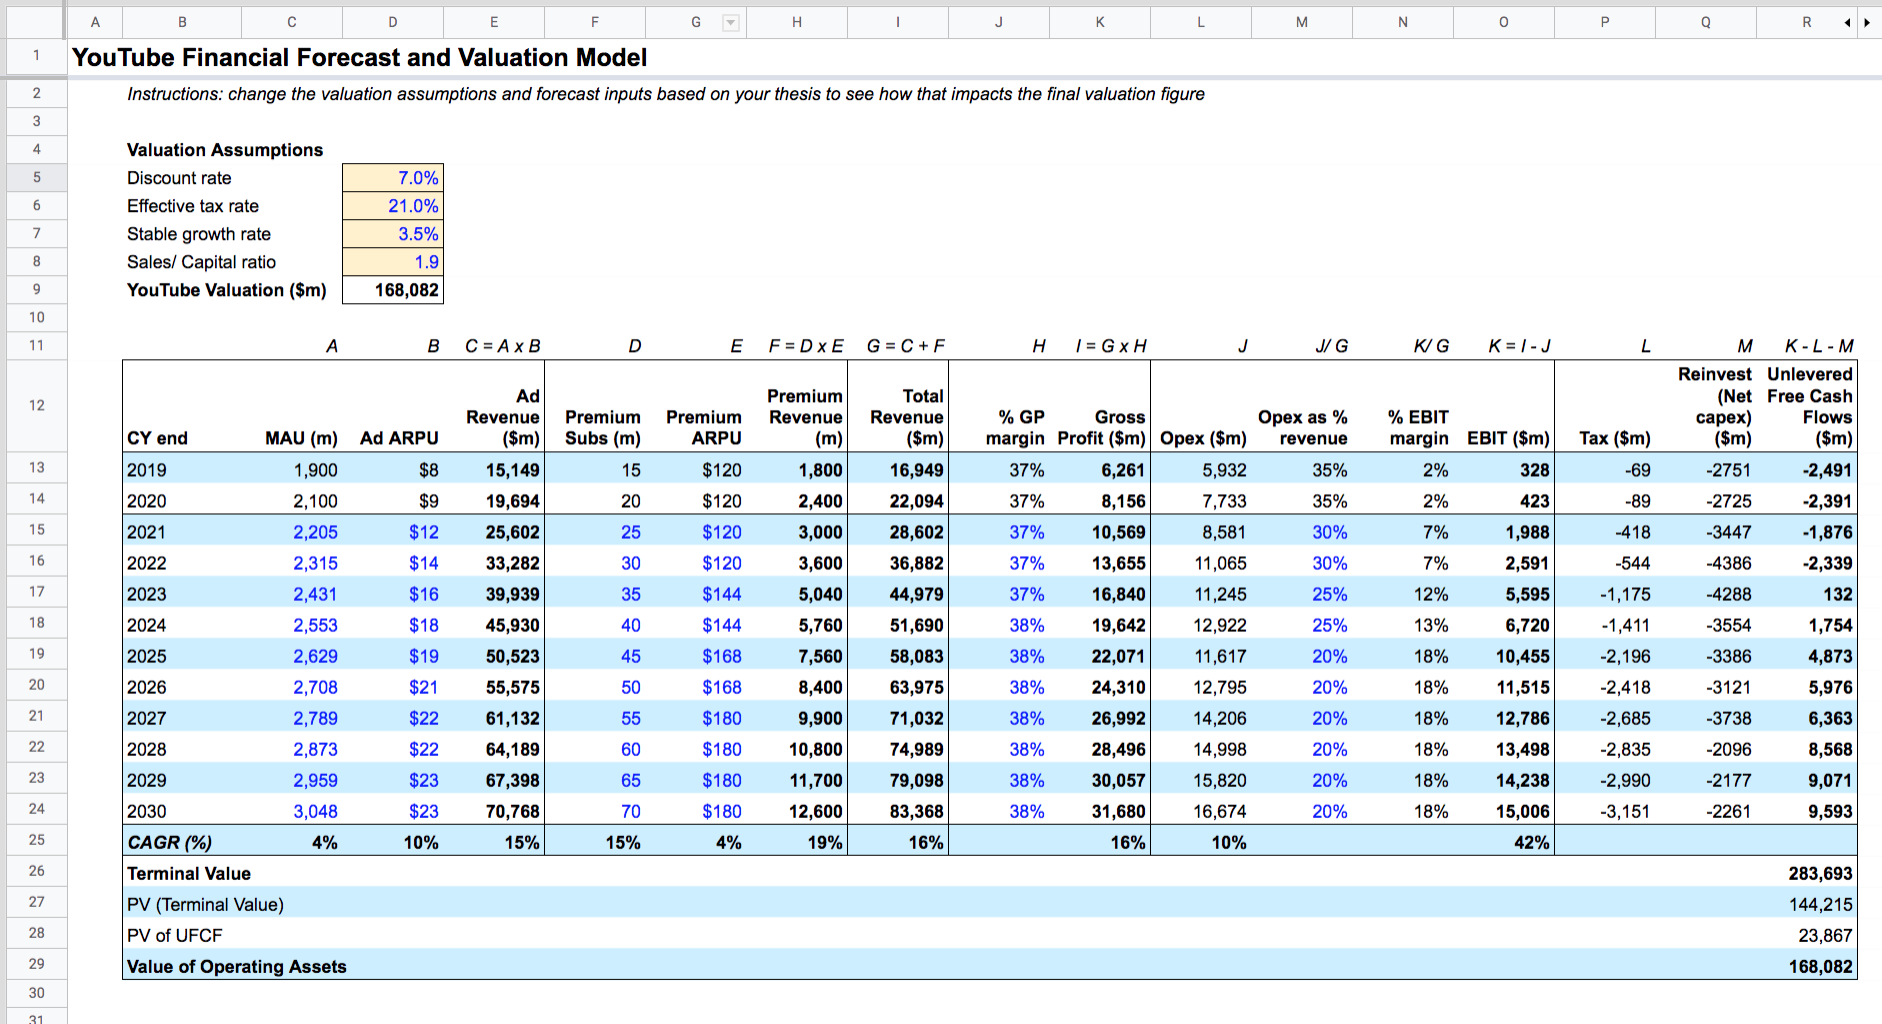
YouTube Summary Valuation
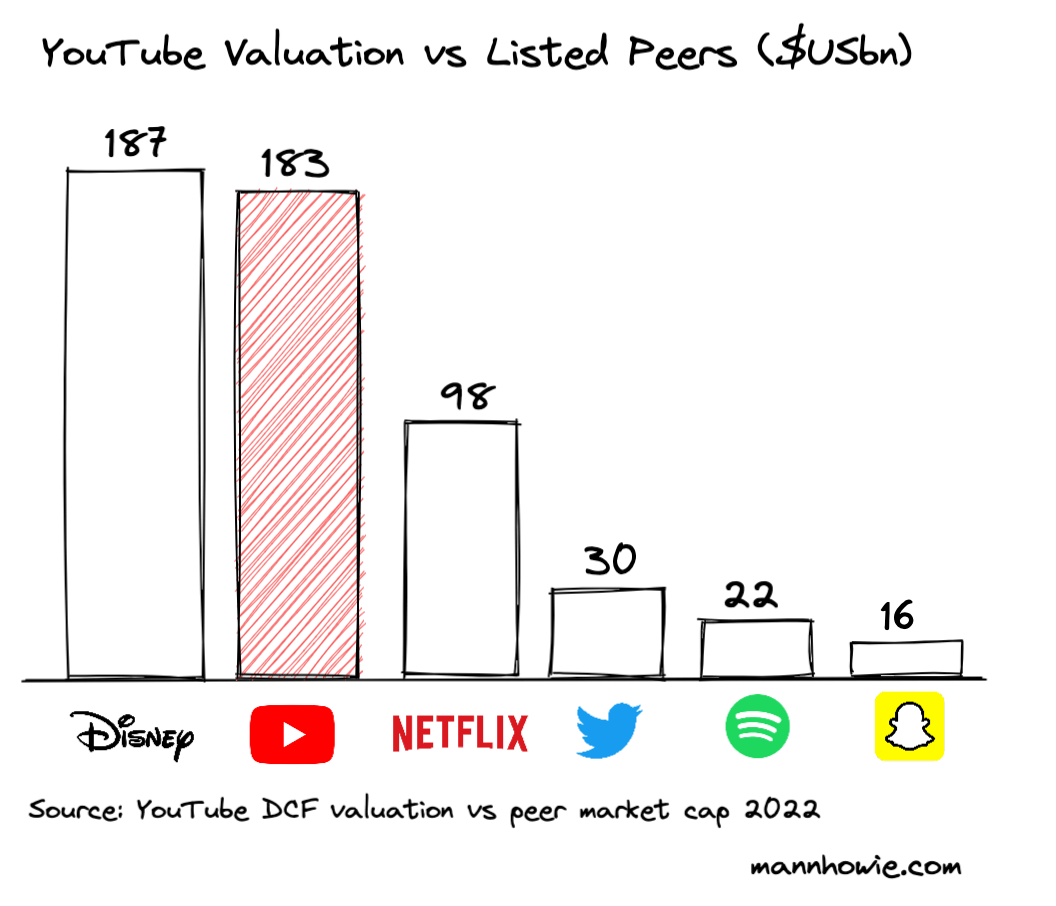
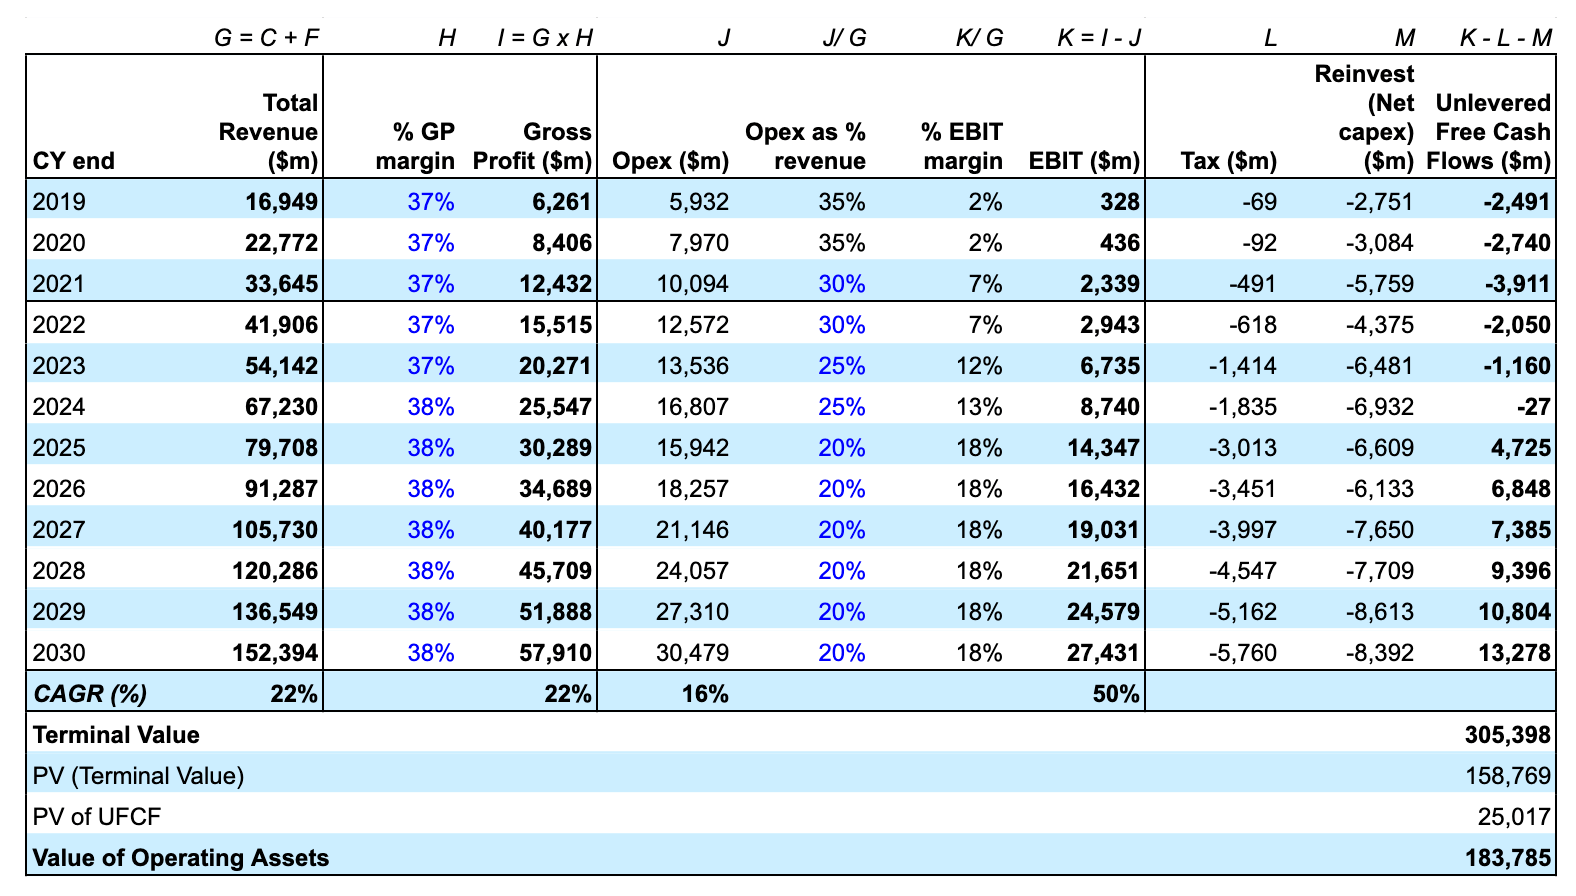 Finally, we can estimate our terminal value and discount it and the sum of our 10 year forecast cash flows to arrive at our valuation for YouTube which equates to US$183 billion. This compares to the US$1.6 billion purchase price Google paid for YouTube in 2006.
If YouTube were a standalone listed company it would be amongst the largest video and entertainment companies in the world:
YouTube parent Alphabet over the course of 2022 traded at an average enterprise valuation of $1.4 trillion which implies YouTube still represents less than 15% of the trading valuation of Alphabet.
A caveat, our valuation is a summary interpretation based on the assumptions we have made. Changes to our assumptions can have a wide impact on the valuation. For example there could be significant upside to earnings if YouTube is able to monetize ad spend via direct search and display ads vs in-video ads (given higher margin earnings), but similarly it could face significant downward pressure if content moderation costs escalate in response to abuse of the platform.
Download Free YouTube Valuation Model
Click below to access the complete summary financial forecast and valuation model for YouTube covered in this article. You may duplicate a copy and adjust the inputs yourself.
YouTube Summary Financial and Valuation Model
Valuation is more art and science. It is more important to understand the key drivers of a business and adjust your model for changes to these assumptions. A valuation should never remain static, but rather change as business conditions or your thesis adjusts.
6 Step Valuation Checklist
Here is a helpful checklist you can follow when approaching to value a company yourself:
- Questions: write out all the key questions you would like answered across the industry, customer, revenue and cost model and growth thesis.
- Research: start by reading annual reports of the company and competitors to answer your questions. Read the description of the business segments and revenue. Identify the key drivers and any missing information that will need to estimate. Read investor presentations for operating metrics and clues that may not be included in annual reports. Avoid investor relations jargon and focus on how the business makes money.
- Build financial model: Start preparing your revenue, cost and cash flow model. Each company is different and each model will be too. Creating a financial model (even in a crude form) will help you identify which areas of the business matter most.
- Experience the offering: once you have identified the key drivers, research the company’s product or service offering. Try it yourself, watch demos, read reviews. Form your own view. Financials are a reflection of the willingness of customers to purchase the offering of the company.
- Growth thesis: Form a thesis and story as to what will drive the revenues and costs of the business going forward (either up or down). Sense check this against industry and competitor/ peer metrics. Incorporate your thesis as the driver of your financial forecasts.
- Valuation: Finally, estimate the terminal value and discount your forecast cash flows to a present value. Adjust inputs based on your thesis to identify how sensitive your valuation is to key assumptions.
Valuation updated from original article (Nov 2020) to reflect post pandemic digital ad spend growth, change in competitive landscape and increase in long term risk free rates
Want more tips?
Get future posts with actionable tips in under 5 minutes and a bonus cheat sheet on '10 Biases Everyone Should Know'.
Your email stays private. No ads ever. Unsubscribe anytime.
My other project
Investor Tool
World's largest tech companies