How to Measure Total Shareholder Returns
2 minute read | Sep 22, 2023
finance
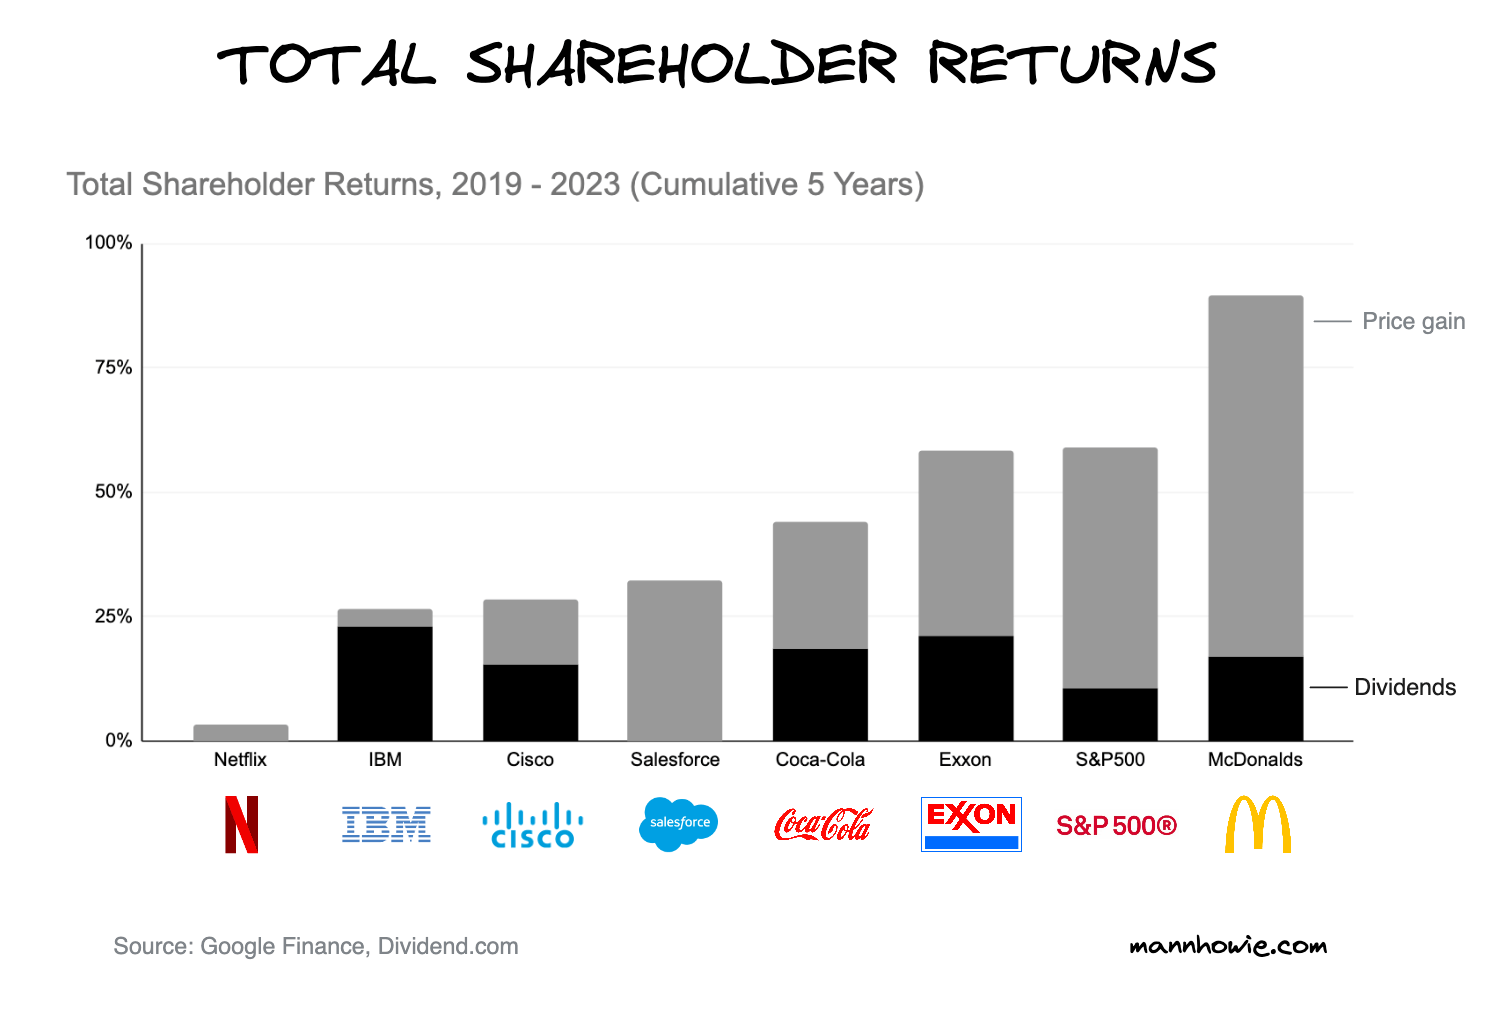
Total Shareholder Returns (TSR) represent the complete returns from investing in a stock, including both price gains and dividends.
It's important to note that dividends, although sometimes overlooked, can significantly boost investment returns.

Comparing Total Shareholder Returns
For instance, over the past 5 years, tech giants like IBM and Cisco have seen share price gains of just 4% and 13%, respectively. This is underwhelming, especially when even cash assets would have given returns of around 10%.
But when you include dividends, IBM and Cisco's returns jump to about 28%. This is comparable to the returns of tech growth stock Salesforce, which doesn't distribute dividends.
Similarly, while Exxon Mobil's share price gains lag behind the broader S&P500, its performance is on par when dividends are considered. Moreover, if dividends were reinvested in the S&P500, both IBM and Cisco would outperform Salesforce, and Exxon Mobil would beat the broader S&P500.
Calculating Total Shareholder Returns
TSR is calculated using the formula:
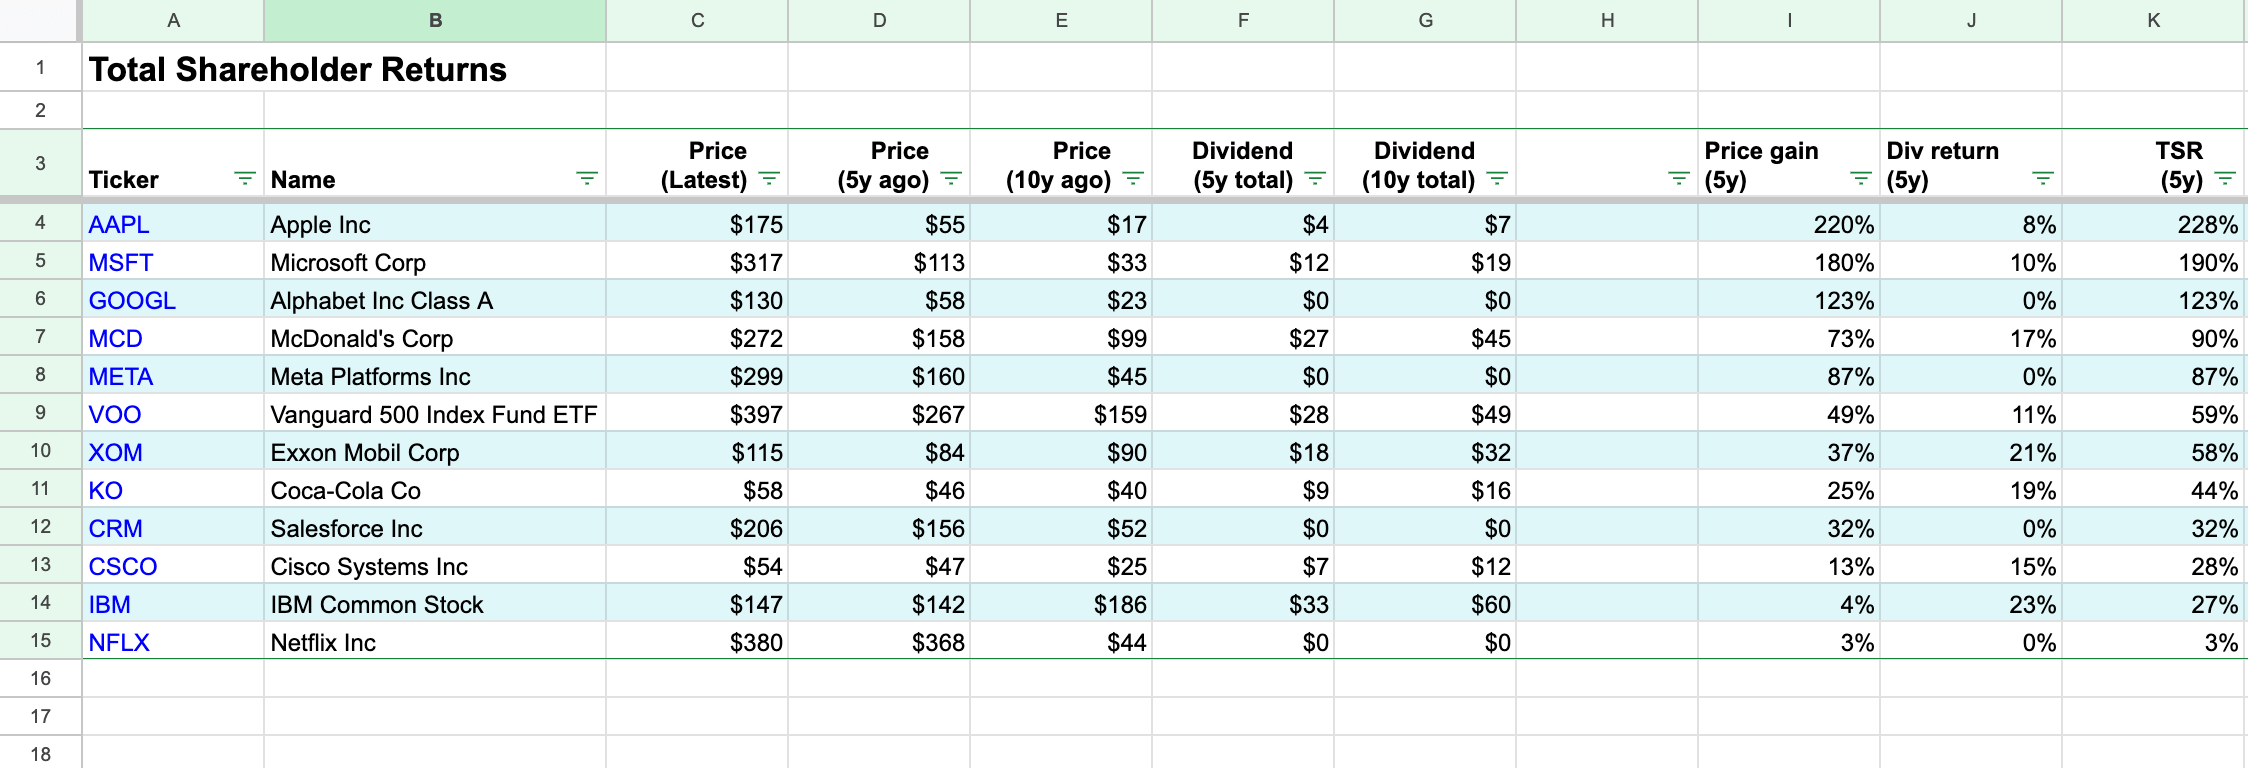
TSR = (Current Price - Purchase Price + Dividends) / Purchase Price
Here, dividends are the total received over the period you're measuring, such as the past 5 years. They are added to the gains from the share price.
Here is an example spreadsheet showing how to create your own TSR comparison table. It uses Google Finance for real time share price data and company dividend data consolidated by Dividend.com.
 Google Sheet - TSR Model
Want more tips?
Get future posts with actionable tips in under 5 minutes and a bonus cheat sheet on '10 Biases Everyone Should Know'.
Your email stays private. No ads ever. Unsubscribe anytime.